Daily flash-meetings have enabled us to build performing software development teams, to reduce work-in-progress and to improve product quality. Understand how with the following Plan-Do-Check-Act case study.
A problem is the starting point: our former project weekly meetings were inefficient. This problem will be described in terms of symptoms and impacts. The root causes will be identified and the plan to solve the problem will be established. Then, the experiments performed according to this plan will be described. Lastly, the results of these experiments will be measured and the lessons learnt will be provided.
Flash meetings are also known as daily stand-up meetings in Agile literature, and daily scrums in the particular case of Scrum.
PLAN
We have been unsatisfied with our former project weekly-meetings.
Duration
With a target duration of an hour, our weekly meetings seemed too long. Many developers just did not like to spend an hour seated in a meeting room. Some felt uncomfortable pausing their development activities during a full hour. Moreover, after some time, long meetings tend to lose dynamism and efficiency. Within a one hour time-box, people do not always manage to stay focused on the highest priority topics. Stakeholders working on their laptop or texting messages during the meeting are a symptom of such loss of focus. Therefore, such meetings ended up by turning into a waste of time and lacked respect for the team's time.
Delay
The meetings could be frustrating. Indeed, problems raised by team members during the meetings (such as desynchronized activities, process, technical or organizational issues) were dealt with too late, on a weekly basis at best. The information reported and monitored was already out-of-date, possibly a week old. The impact of daily work on our goals was not obvious, or was visible too late to enable us to drive our activities and aim for the expected performance. It was like steering a project which a one week delay, or like driving a car with your eyes open an hour per week.
Implication
On the long-term, some team members considered the meeting a waste of time and did not attend systematically. Some attended, but avoided to participate in fear of prolongating the meeting. Individually, the stakeholders reported their status, but the meeting was not a session of teamwork. Team members could feel a loss of interest and of implication in their project. This was mostly the case for long projects (over 3 years). Moreover, projects teams were not performing as expected.
Root causes
The main root cause of this problem is an issue of frequency and duration. The periodicity of the meeting was low enough to create an accumulation of information and of problems to deal with. The periodicity was low enough to imply out-of-date data and missed synchronization points. In other terms, the frequency of the meeting (1 week) was much lower than the frequency of the problems to solve and of the decisions to take (typically 1 day). Therefore it was impossible to steer the activities with satisfying reactivity.
In more Lean terms, our organization was building a week-worth stockpile of information every week, and was processing this stockpile only once a week. Unfortunately, some information (such as problems) within the one-week stockpile needed to be processed on a mush shorter notice.
Moreover, within the one hour target duration, part of the allocated meeting time was wasted on lower priority topics.
DO
To assess the root cause, we have decided to dramatically raise the periodicity and reduce the duration of the meetings. Since 7 years we have been running short daily flash-meetings. Two of our development teams are currently running the following standard:
Current standard
Step #1: Kick-off
The team meets for 15 minutes in the project war-room every day at the same hour. The team members rotate to lead the meeting according to a calendar displayed in the war-room. The daily leader calls the meeting and makes sure all stakeholders are present. All team members stand in a semi-circle, facing the project charts and task-board. Only the daily leader is seated, however also facing the charts. He edits the iteration backlog spreadsheet on a computer. It contains the prioritized list of development tasks for the current iteration, with status, costs and estimates. Only he sees the screen and the iteration backlog during the meeting.
Step #2: Nightly build
Firstly, the daily leader reports the status of the nightly build. He organizes corrective actions if the build has failed and is not yet corrected. A build failure is considered a problem. Thanks to a long-term problem-solving, the nightly build is now successful over 70% of the time. Among other tasks, the nightly build
- builds the executable files,
- runs the white-box unit-tests,
- runs the black-box acceptance tests,
- measures the product quality,
- controls the build andon (a green/red light and a bell, green for success and red for failure).
Step #3: Product quality
Then, the team reports the product quality metrics while updating the quality graphs and trends. The team dispatches further analysis and corrective actions if product quality has decreased. A decrease in product quality is considered a problem.
In fact, the team does not measure product quality, but product non-quality instead. The product non-quality is the sum of
- the number of lines of code not fully covered by tests: instruction and modified condition/decision coverage rates (expected 0),
- the number of warnings in the code & tests the tests (expected 0),
- the number of times the coding standards are not fulfilled (expected 0),
- the number of traceability errors (expected 0),
- the number complex operations (expected 0 operation with a cyclomatic number over 6),
- the number of 'todo' & 'fixme' tags in the code & tests (expected 0),
- the number of tickets to estimate (expected 0),
- the number of opened tickets (expected 0).
All of these values are automatically measured by the nightly build. The value the sum makes no sense. However, a negative trend means that the product quality is improving. On the other hand, a positive trend reveals a quality decrease, and therefore a problem to solve.
The number of defects identified by the customer per thousand source lines of code on our incremental deliveries is monitored. However, this metric is too low and stable (below 0.1 per KSLOC) to enable to steer activities.
Step #4: Development tasks
Then, reading the iteration backlog spreadsheet, the daily leader runs through the development tasks by order of priority. By task priority, the developers report their status to the team in terms of time spent, progress, re-estimation of remaining work and problems encountered. They visually update their work-in-progress on the project task-board while reporting their tasks by mowing their task-cards to the appropriate steps of the value-stream-map. The daily leader updates the task status, costs and estimates in the iteration backlog spreadsheet while the team members report their activities. The problems raised are displayed and assessed for immediate action or further analysis.
Once of all of the tasks in-progress have been scanned, the available team members pull new tasks from the iteration backlog by order of priority.
If developers report complex problems or technical issues, the daily leader invites the stakeholders to resume the topic after the daily flash meeting.
Step #5: Team performance
Once all the tasks have been scanned and updated, the daily leader reports the team performance to the team. This performance is measured according to the data provided by the team members and updated by the daily leader in the iteration backlog spreadsheet. The team performance is expressed in terms of costs, progress and product quality. The team members update the metrics on their performance graphs.
Step #6: Decisions
Lastly the team analyzes the graphs, ends the meeting and shares on the day's challenge over coffee before resuming the development tasks according to their decisions.
Duration
If the team repeatedly doesn't manage to run its flash meetings within a 15 to 20 minutes timebox, then the team measures, displays and monitors the duration of the meeting day after day. The team finds solutions to shorten the meeting and checks that their corrective actions are effective. If the root cause of lengthy meetings is an oversized team, then the team splits into smaller teams. The team is split exactly as code is modularized: according to loose coupling and high coherence. Then each team runs 15-minute daily flash meetings, one after the other. To deal with inter-team dependencies, a team member participates to the flash meetings of the other teams of the same project. Then, a team lead updates and displays the consolidated performance of the teams.
This standard is our current best way of running flash-meetings. We are confident in the fact that the teams will continue to improve it.
CHECK
We have noted and measured the following results:
Frequency
We run flash-meetings every working day since 7 years (which represents over 2500 meetings). Five of our project teams have practiced or are still practicing daily flash-meetings. The context ranges from a typical 7-member to one 50-member cross-functional project team. For this large project, the team was split into 4 cross-functional teams, each running its own daily flash-meeting.
Duration
With 15 to 20 minutes per daily flash-meeting, the overall time spent in status meetings stands somewhere between 1h15 and 1h40 per week. Therefore, compared to our former weekly meeting situation, the overall time spent in status meetings has not been reduced.
Focus
With a target duration of 15 minutes, the team members remove all unnecessary information from the meeting. By reducing the duration of the meeting, they focus on what is most important. The focus is set on steering, performance and problems. Because the team members stand up during the meeting and because the meeting remains short, laptops and cellphones are naturally excluded from the meeting.
Visible team performance
Progress, costs and product quality graphs are displayed and are up-to-date. Problems are displayed and corrective actions or further analysis are in progress. The team members share a common vision of the development tasks to perform and of their priority. They share a vision of their performance in terms of costs, progress and product quality.
The work-in-progress is visualized on the task-board, revealing flow, problems, dependencies and bottlenecks. Software development is now visible and displayed in total transparency.
Work-in-progress and product quality
The amount of work-in-progress has been reduced to 2 scales: the day and the iteration (a timebox of 10 work-days). Product quality has been raised, as each iteration visibly improves the quality of the product.
Implication
The team members attend and actively participate every day. The meeting leader rotates every day among the team members. All the team members get to act as the daily leader.
The meeting is a session of intense and focused teamwork. The team members are very concerned by the project costs and milestones and by the product quality. This is obvious because the performance graphs are up-to-date and commented. We notice that this rigor remains for long projects (over 4 years).
Continuous improvement
The meetings have a standard that is displayed in the war-room. It has changed several times: it is improved and adapted to the problems the team is currently facing.
ACT
We have learned many things by practicing daily flash-meetings.
The war-room
A dedicated war-room is very useful when several teams share a common workspace. Because all the team members get to talk during the meeting, the level of noise can be quite disturbing for neighbors. Visual management is used to display the performance graphs, the task-board and the problem-board. These information radiators are made of paper and magnetic boards, all updated by hand during the meeting.
The schedule
The meeting must not occur too soon in the morning as team members need to gather information for the meeting (such as the status of the nightly build and quality metrics computed by the build). Also, they need to investigate any build or product quality issues. However, the meeting must be scheduled early enough to plan the day. Our meetings are typically scheduled to start between 9AM and 10AM.
Because the meeting takes place at the same time every day, the schedule should be booked for all the team members on their calendar to avoid conflicts with other meetings on the same slot.
Computers and screens
Only the team leader must use a computer during the meeting (in order to update the costs and progress of the tasks). The team must focus on the large visual task-board and on reporting and sharing information. Running the meeting in front of a large screen has been a failure, as team members focus on updating the iteration backlog spreadsheet instead of focusing on updating the status of their activities. This is why only the daily team leader sees the iteration backlog file.
PDCA
We have learned that a daily flash-meeting defines the conditions of success for the day. This is the first step to success! Then, team members take action to meet success. Indeed, each day can be seen as a short Plan-Do-Check-Act cycle. The team starts the day by defining the today's challenge. Then, the team members plan the activities of the day in order to finish the agreed-upon tasks (Plan). The action resumes after the meeting (Do). Tomorrow, the team will check their performance (Check) in order to adjust their behavior to succeed tomorrow's challenge (Act).
Work-in-progress
Combined with the nightly build, the daily flash-meeting enforces a daily cycle within which tasks are done. This greatly helps to reduce work-in-progress. It also helps to steer the project, as daily tasks enable to visualize daily progress.
Product quality
A problem that is not visible does not exist. Thanks to the product quality graph (updated on a daily basis and displayed with the other performance charts) any decrease in product quality becomes a visible problem and a visible challenge for the team. The impact of corrective actions led to raise product quality will be visible the following day. Thanks to this visible impact of a day of work on product quality, the team visibly improves the product quality, day after day.
Visible impact and motivation
With visible daily feedback on performance, the team visualizes the impact of their day of work on their common goals. Therefore, the team sees that they can make a difference, and that they have results. We believe that this is a great motivator and enhances autonomy.
Project steering
The daily flash meeting can been seen as a daily short session of project steering. After such practice, we now believe that a single iteration burndown chart is not sufficient to steer the activities of the iteration during the meeting. A single iteration burndown chart (as practiced in Scrum) mainly focuses the team on completion of work within the milestone. Little focus is set on costs and product quality. Also, a single burndown chart enables to visualize that the team has a problem: for example that progress is slower than expected. However, it does not help the team to visualize why it has a problem.
This is why we have standardized the use of several performance charts during flash-meetings. We use one product quality chart, several progress charts and several cost charts.
The progress charts are burndowns which focus on the completion of work within the milestone. We have a global "progress burndown" for the full iteration scope, and one per goal of the iteration.
The cost charts are burndowns which focus on the completion of work within the allocated budget. We have a global "cost burndown" for the full iteration scope, and one per goal of the iteration.
This set of charts reveals which task is setting (or risks to set) the iteration into trouble. For such a task, the charts reveal if the issue concerns progress and/or costs. By visualizing all this information, the team takes decisions and steers its activities. In fact, the project war-room is more of a project cockpit.
Learning
The practice of flash-meetings enables the team members to develop skills. They learn to lead the meeting by following and improving the meeting standard. They learn to organize self-directed work with pull systems such as prioritized tasks lists (the iteration backlog) and task-boards in order to gain autonomy. They learn to identify and solve problems by defining their standards, by visualizing work-in-progress and by practicing problem-solving. By measuring and analyzing performance on a daily basis, the team members learn to take action based on facts and charts. They also share knowledge at least once per day. The team learns teamwork. This organization of learning aims for what Daniel Jones calls "the capability of the team to sustain and improve once you leave".
Continuous improvement
We have learned that rotating among team members to lead the flash meeting is a great way to involve everyone in the continuous improvement of the meeting. The improvement of the daily flash meeting is a great case-study for learning and practicing continuous improvement. Indeed, it is a short activity performed every day according to a standard. This know-how may then be reused for other activities. Indeed, as Daniel Jones says: "The lasting value is the capability to solve the next set of problems".
Discipline
The practice of daily flash-meetings implies a lot of discipline. The meeting must occur to establish the development tasks to perform that day. The meeting must start and finish on time, as several similar meetings follow each other in sequence. Each developer must focus on reporting only relevant information as all developers must manage to report their status and steer their activities within a 15 to 20 minute time-box. Typically, technical issues and complex problems must be set aside to be dealt with after the meeting among the relevant stakeholders.
Respect
Finally, the daily flash-meetings are a framework within which the team members share goals, responsibility and success; and develop skills and autonomy. This defines an environment of respect for people, their work and their time.
Customer satisfaction
Daily flash-meetings enable to develop teams, who improve their way of working day after day, to build higher quality products on-time for their customers.


 UN RAPPEL A L'ORDRE
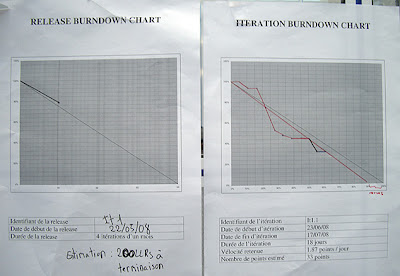 L'équipe affiche ses burndown chart. Cela lui permet de voir une mesure de sa production. Si la courbe tracée est au dessus de la droite descendante à 45°, cela révèle un problème: la production est en retard par rapport à la planification.
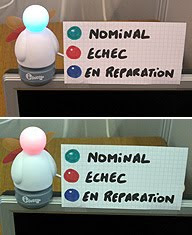 L'équipe a connecté un iBuddy au poste d'intégration continue. Dès que l'outil d'intégration continue détecte une modification dans le dépôt de code et lance un build, l'iBuddy agite les ailes et sa tête change plusieurs fois de couleur. Cette chorégraphie, répétée plusieurs fois par jour, permet de visualiser le flux continu des contributions dans le dépôt de code. Tant que le build est réussi, la tête de l'iBuddy reste verte. Sa tête devient rouge pour révéler un problème: le build est en échec et donc le produit n'est plus opérationnel!
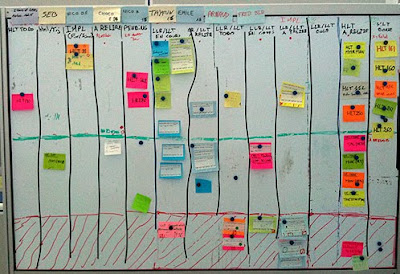 L'équipe pilote la production en utilisant des Kanbans. Cela lui permet de voir la production en cours. Les kanbans révèlent plusieurs problèmes: la discontinuité du flux avec l'apparition de stocks et de goulets d'étranglement et le rework avec les produits défectueux collectés dans le bac rouge.
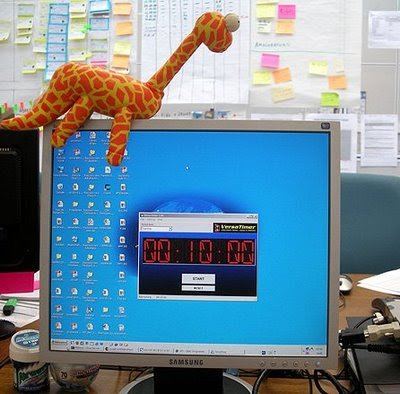 L'équipe utilise un sémaphore d'intégration pour mener l'intégration continue du produit. Chaque fois qu'un développeur se synchronise et délivre ses modifications dans le dépôt de code, il place un unique marqueur (une peluche, alias Guizmo) sur son écran. Cela permet de voir le flux continu de production qui enrichit le produit. Cette pratique révèle également deux problèmes: un sémaphore qui ne circule pas dans l'équipe signale un flux discontinu et un sémaphore bloqué sur un poste révèle une intégration douloureuse.
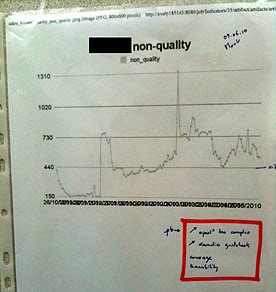 Quotidiennement, l'équipe affiche la quantité de non-qualité automatiquement détectée dans le produit. Cela permet de visualiser l'évolution de la qualité de la production. Cela permet aussi de révéler lorsque le produit n'a plus la qualité attendue.
